Advice on recycling and resource recovery infrastructure
Moving towards a circular economy
In this report, we provide advice to the Victorian Government on improving recycling and resource recovery in Victoria.
We look at the role government can play to help the sector perform better. We also explore what needs to happen to help Victoria move towards a circular economy.
We make 13 recommendations to the Victorian Government to minimise waste and build a stronger and more sustainable recycling and resource recovery industry across the state.
Key findings
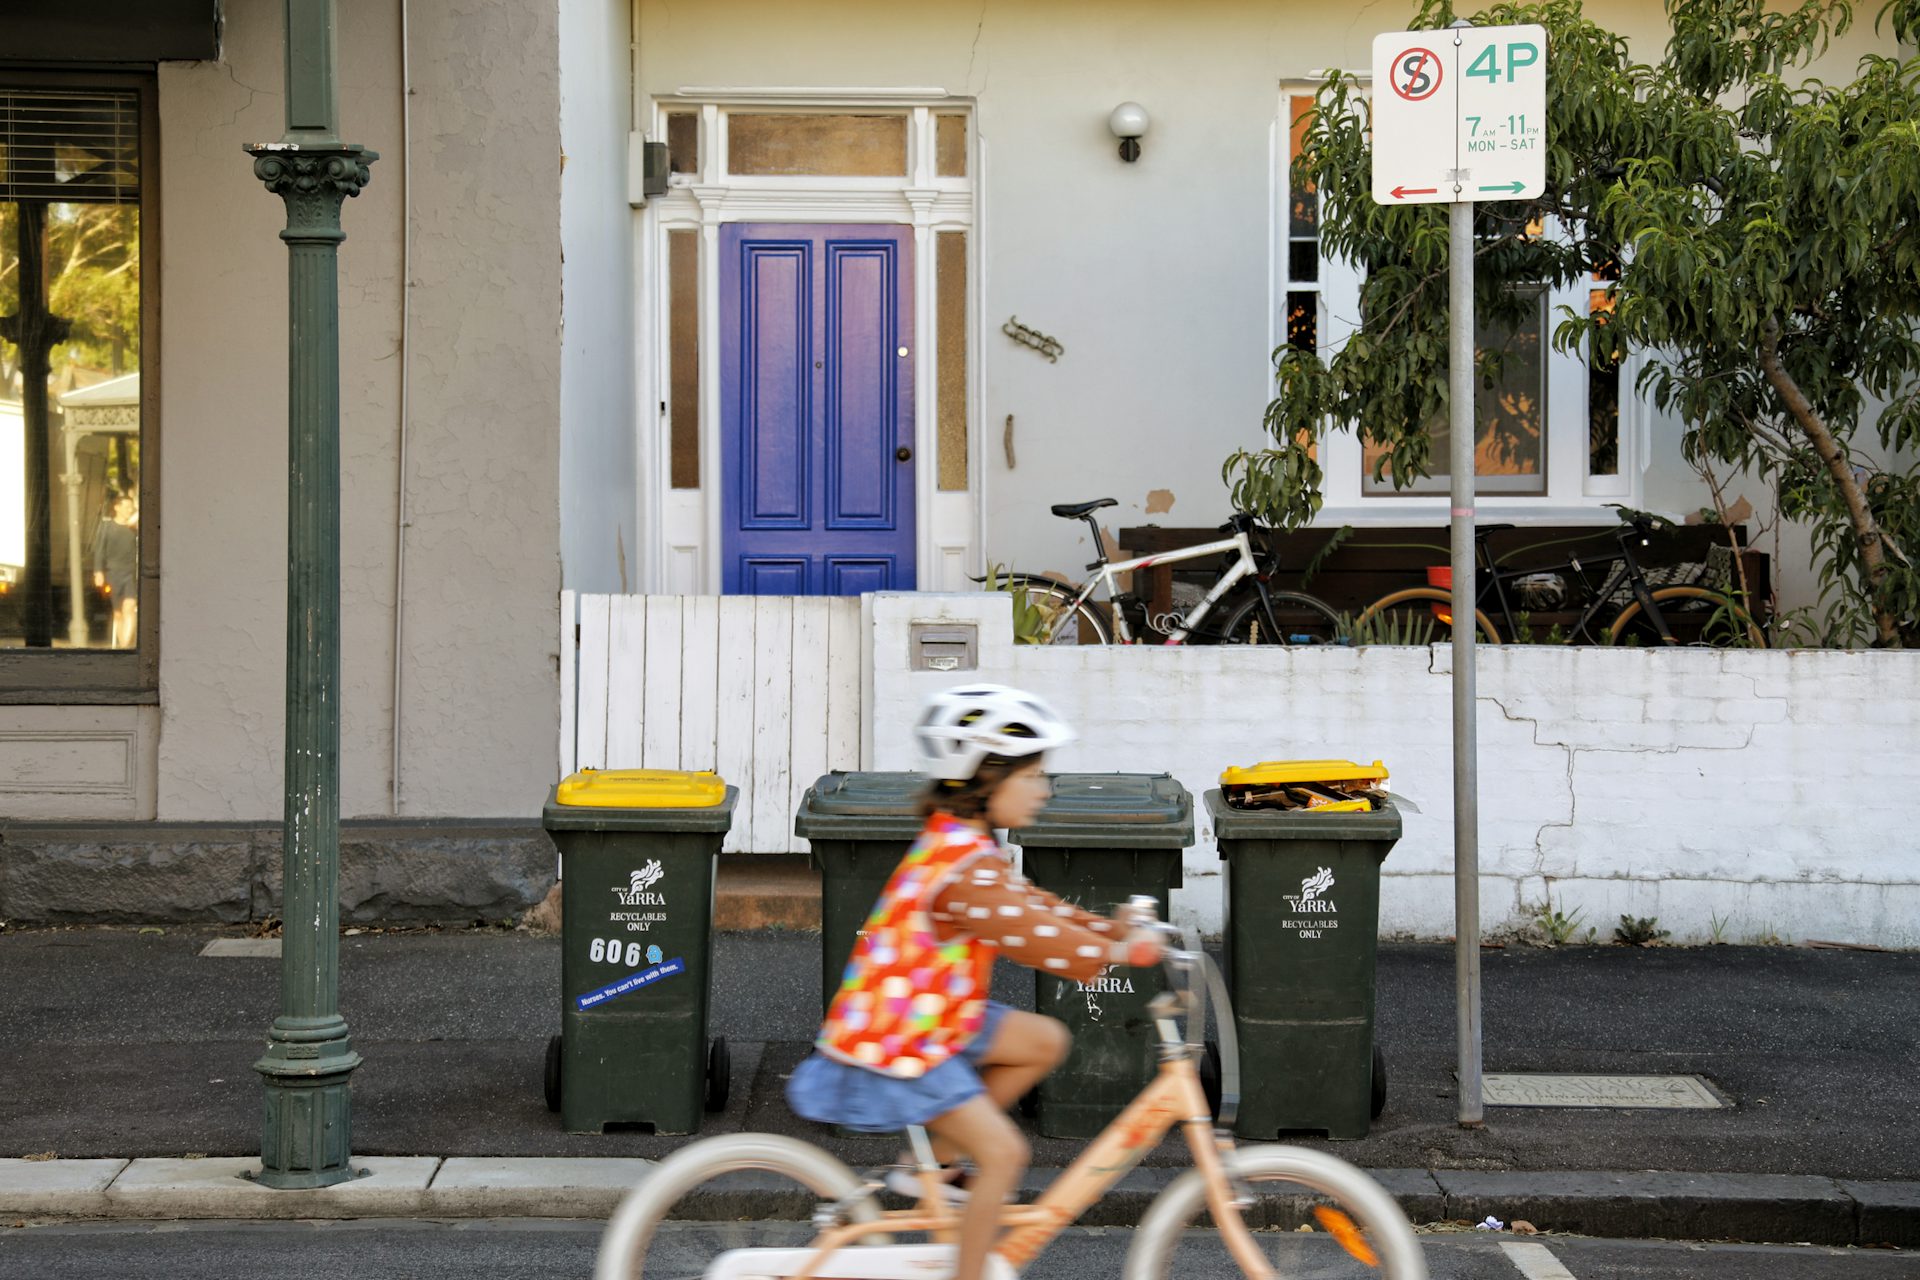
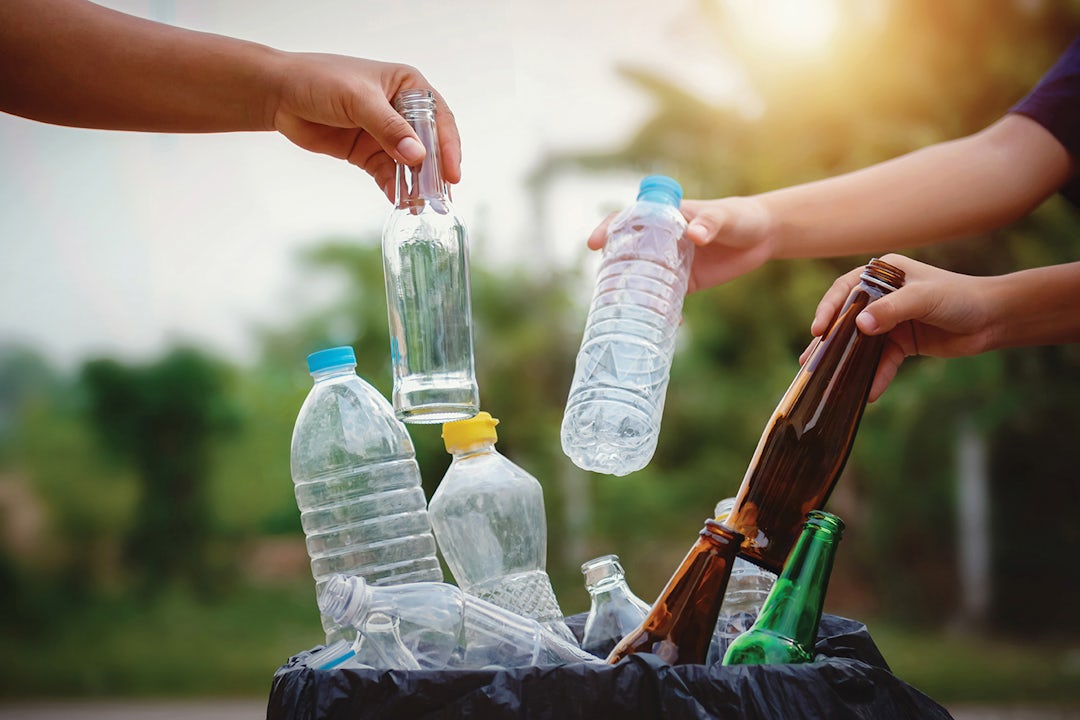
- There are 6 priority materials for the recycling and resource recovery sector to manage: plastic, paper and cardboard, organics, e-waste, glass, tyres.
- Focusing on these priority materials could help Victoria recycle up to 90% of its waste and create over 5,000 jobs by 2039, many in regional areas.
- A consistent approach to kerbside waste collection across the state, and greater separation of materials, will make it easier for Victorians to recycle correctly.
- The Victorian Government can swork with other governments and stakeholders to decrease recycling and resource recovery materials.
- Cleaner waste streams can lower processing costs and improve the quality of products produced from recycled materials.
- Government and business investment in infrastructure can recover more priority materials and support processing and reuse of those materials within the state. We identify 87 potential new or upgraded facilities - 52 in regional Victoria.
- The Victorian Government can stimulate demand by buying products made from recovered materials. It can help create new markets through research and development to test new uses.
Recommendations
- Improve infrastructure capacity and capability for recovering and reprocessing priority materials.
- Increase the diversion of organic waste from landfill.
- Provide clarity to the waste-to-energy sector and establish regulatory settings to achieve desired waste-to-energy outcomes.
- Review funding mechanisms to increase infrastructure capacity and capability.
- Provide ongoing statewide and locally tailored behaviour change programs.
- Reduce contamination in materials streams.
- Remove barriers and strengthen markets for priority materials.
- Ensure that producers and consumers involved in making and using products share the responsibility for their fate.
- Provide greater clarity of roles and responsibilities of Victorian Government bodies involved in recycling and resource recovery.
- Use targets to drive performance.
- Strengthen the status of and processes around the Victorian Recycling Infrastructure Plan (VRIP).
Public submissions
We recieved 53 public submissions on our interim report, Evidence base report: recycling and resource recover infrastructure. You can view submissions from organisations and individuals who consented to their submission being published.
Alan Couchman – recycling evidence base submission – 13 December 2019
Alex Fraser Group – recycling evidence base submission – 13 December 2019
Australian Food and Grocery Council – recycling evidence base submission – 13 December 2019
Australian Packaging Covenant Organisation – recycling evidence base submission – 13 December 2019
Barwon Water – recycling evidence base submission – 13 December 2019
Bayside City Council – recycling evidence base submission – 13 December 2019
Ben Gianchino – recycling evidence base report submission – 3 November 2019
Cement Concrete & Aggregates Australia – recycling evidence base report submission – 6 December 2019
City of Greater Bendigo – recycling and resource recovery submission – 16 December 2019
City of Greater Dandenong – recycling evidence base submission – 13 December 2019
City of Greater Geelong – recycling evidence base submission – 13 December 2019
City of Port Phillip – recycling evidence base submission – 12 December 2019
Cobalt Design – recycling evidence base submission – 11 December 2019
Colac Otway Shire – recycling evidence base report submission – 29 November 2019
Corangamite Shire Council – recycling evidence base submission – 12 December 2019
Duncan Rouch – recycling evidence base report submission – 18 November 2019
Glen Eira City Council – recycling evidence base submission – 13 December 2019
Jim Tutt – recycling evidence base submission – 13 December
Katherine Hollaway – recycling evidence base report submission – 10 November 2019
Licella Holdings – recycling evidence base submission – 13 December 2019
Mark Korvin – recycling evidence base submission – 13 December 2019
Maxen Consulting Group – recycling evidence base report submission – 22 October 2019
Moreland City Council – recycling evidence base submission – 13 December 2019
Mount Alexander Shire Council – recycling evidence base submission – 13 December 2019
Moyne Shire Council – recycling evidence base report submission – 4 December 2019
Municipal Association of Victoria – recycling evidence base submission – 13 December 2019
North East Waste and Resource Recovery Group – recycling evidence base submission – 13 December 2019
Northern Grampians Shire Council – recycling evidence base submission – 13 December 2019
NWRIC Recycling Evidence Base Submission 17 December 2019
Oil Fox Australia – recycling evidence base report submission – 3 December 2019
PACT Group / Viscount Plastics – recycling evidence base submission – 13 December 2019
Pat Keating – recycling evidence base submission – 13 December 2019
Planet Ark Environmental Foundation – recycling evidence base submission – 13 December 2019
SUEZ – recycling evidence base submission – 12 December 2019
Surf Coast Shire – recycling evidence base submission – 13 December 2019
Teletrac Navman – recycling evidence base submission – 9 December 2019
Tetra Pak – recycling evidence base submission – 13 December 2019
Tim Fraser – recycling evidence base report submission – 21 October 2019
Tony Smith – recycling evidence base submission – 13 December 2019
Supporting documents
Waste and resource recovery infrastructure gap analysis
Technical document
PDF 5MB
Download
Waste and resource recovery infrastructure data and spatial analysis
Technical document
PDF 3MB
Download
Economic policy development framework - Recycling and resource recovery infrastructure
Technical document
PDF 3MB
Download
Related resources
Browse all resourcesIs Victoria making progress towards a circular economy?
In this webinar, hear the experts discuss Victoria’s efforts to reduce waste and progress towards a circular economy.
Evidence base report: recycling and resource recovery infrastructure
Infrastructure Victoria’s interim report on the recycling and resource recovery sector in Victoria.